Introduction
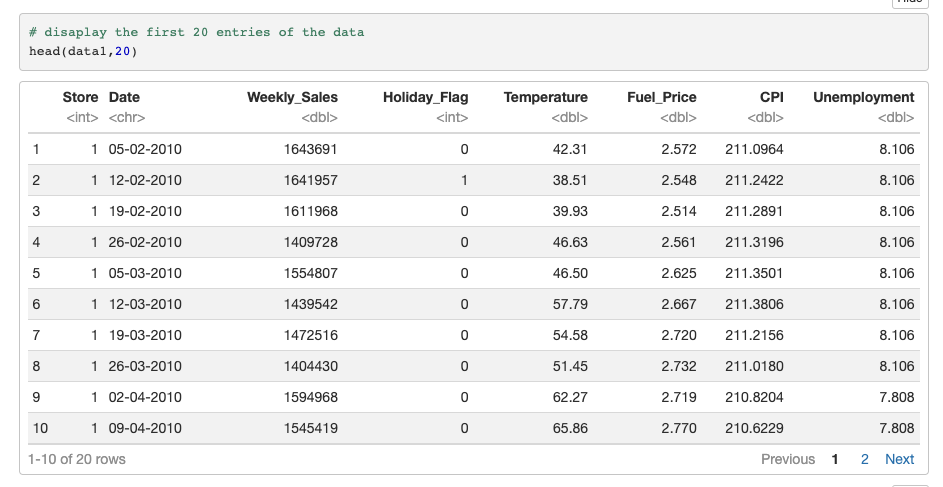
The Walmart Sales Prediction project aims to analyze and predict the weekly sales for Walmart stores across various regions in the United States. This project uses a dataset from Kaggle that includes sales data from multiple stores, alongside other variables like temperature, fuel price, CPI (Consumer Price Index), and unemployment rates. The primary objective is to understand the factors affecting the weekly sales and build a predictive model using R programming language. The R libraries rio is used for importing data, dplyr and tidyr is used for data manipulation, ggplot and plotly are used for data visualization.
Data Exploration and Visualization
Data Preprocessing
- Handling Missing Values: The dataset from Kaggle was found to be clean with no missing or NaN values. However, a demonstration was given on how missing values could be introduced and then handled using R’s mutate and filter functions from the dplyr library.
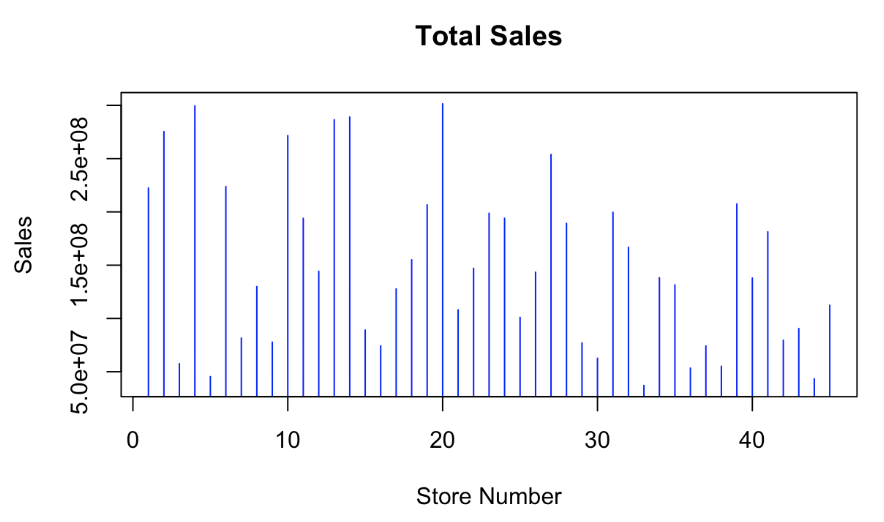
- Data Transformation: The data was grouped by store number and aggregated to compute the total sales for each store, which allowed for a comparison of sales performance across different locations
Data Visualization
- Weekly sales versus store Number: A bar plot showing total sales for each store indicated significant variation in sales performance, potentially due to regional differences.
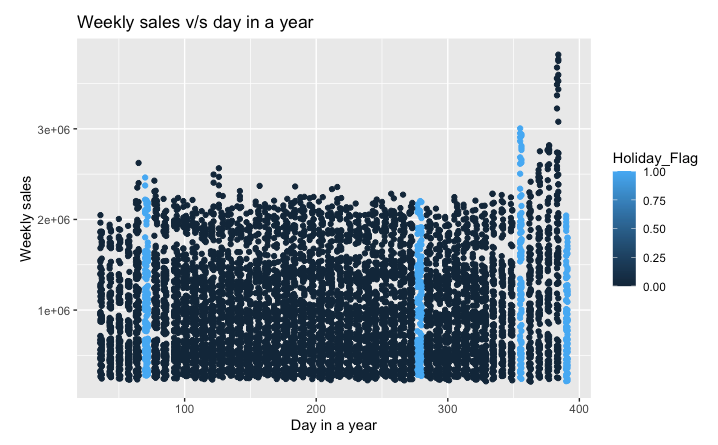
- Weekly sales over days in a year: Scatter plots of sales over time for individual stores revealed patterns such as increased sales during holidays.
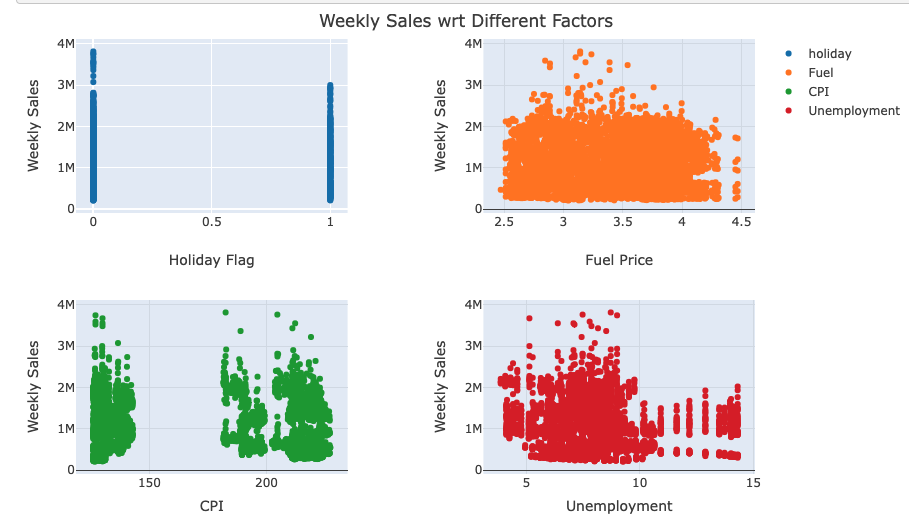
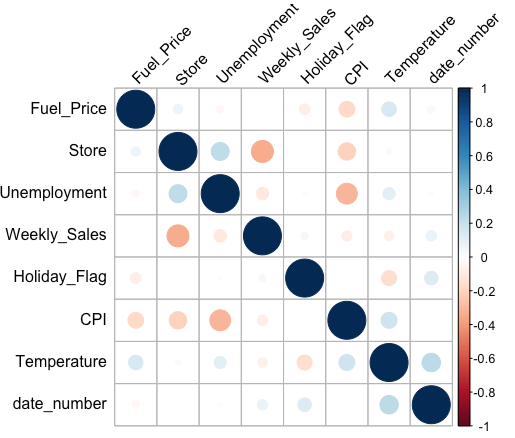
- Correlation Plots: Multiple scatter plots were created to explore the correlation between weekly sales and other variables like temperature, fuel price, CPI, and unemployment. It was observed that weekly sales were not strongly correlated with these factors, except for a slight negative correlation with unemployment rates.
- Correlogram showing the correlation strength (radius of the circle) and color (positive/negative) between different features in the dataset.
- Principal component analysis was conducted to understand the hidden correlations between parameters. However, the first 2 components only explained only 36 % of the variance in the data and no correlation between parameters were found
Machine Learning Modeling
- The data was fitted with the linear regression, polynomial regression and the random forest regression models.
- Linear Regression: RMSE = high, R2 score = 0.14 suggesting the model is underfit.
- Polynomial Regression: A 5th order polynomial model regression resulted in lower RMSE and R2 score = 0.74 suggesting a decent model.
- Random Forest: Utilized 300 trees and a sampling with replacement of 2000 samples resulted in the lowest RMSE and R2 score = 0.98 for the training data. The model evaluated on validation and test data resulted in little higher RMSE compared to training set, but achieved R2 score = 0.93. The results suggests that the random forest is doing a good job in the prediction of weekly sales.
Conclusions
The project provides a comprehensive analysis of Walmart’s weekly sales data, revealing key trends and patterns that can inform business decisions. The insights gained from the exploratory data analysis suggest that the holidays and store locations, play a crucial role in driving sales.
The complete code for this R project can be found here.